Logo PharosFolio®
Advanced ETF & ETC portfolio simulation made simple
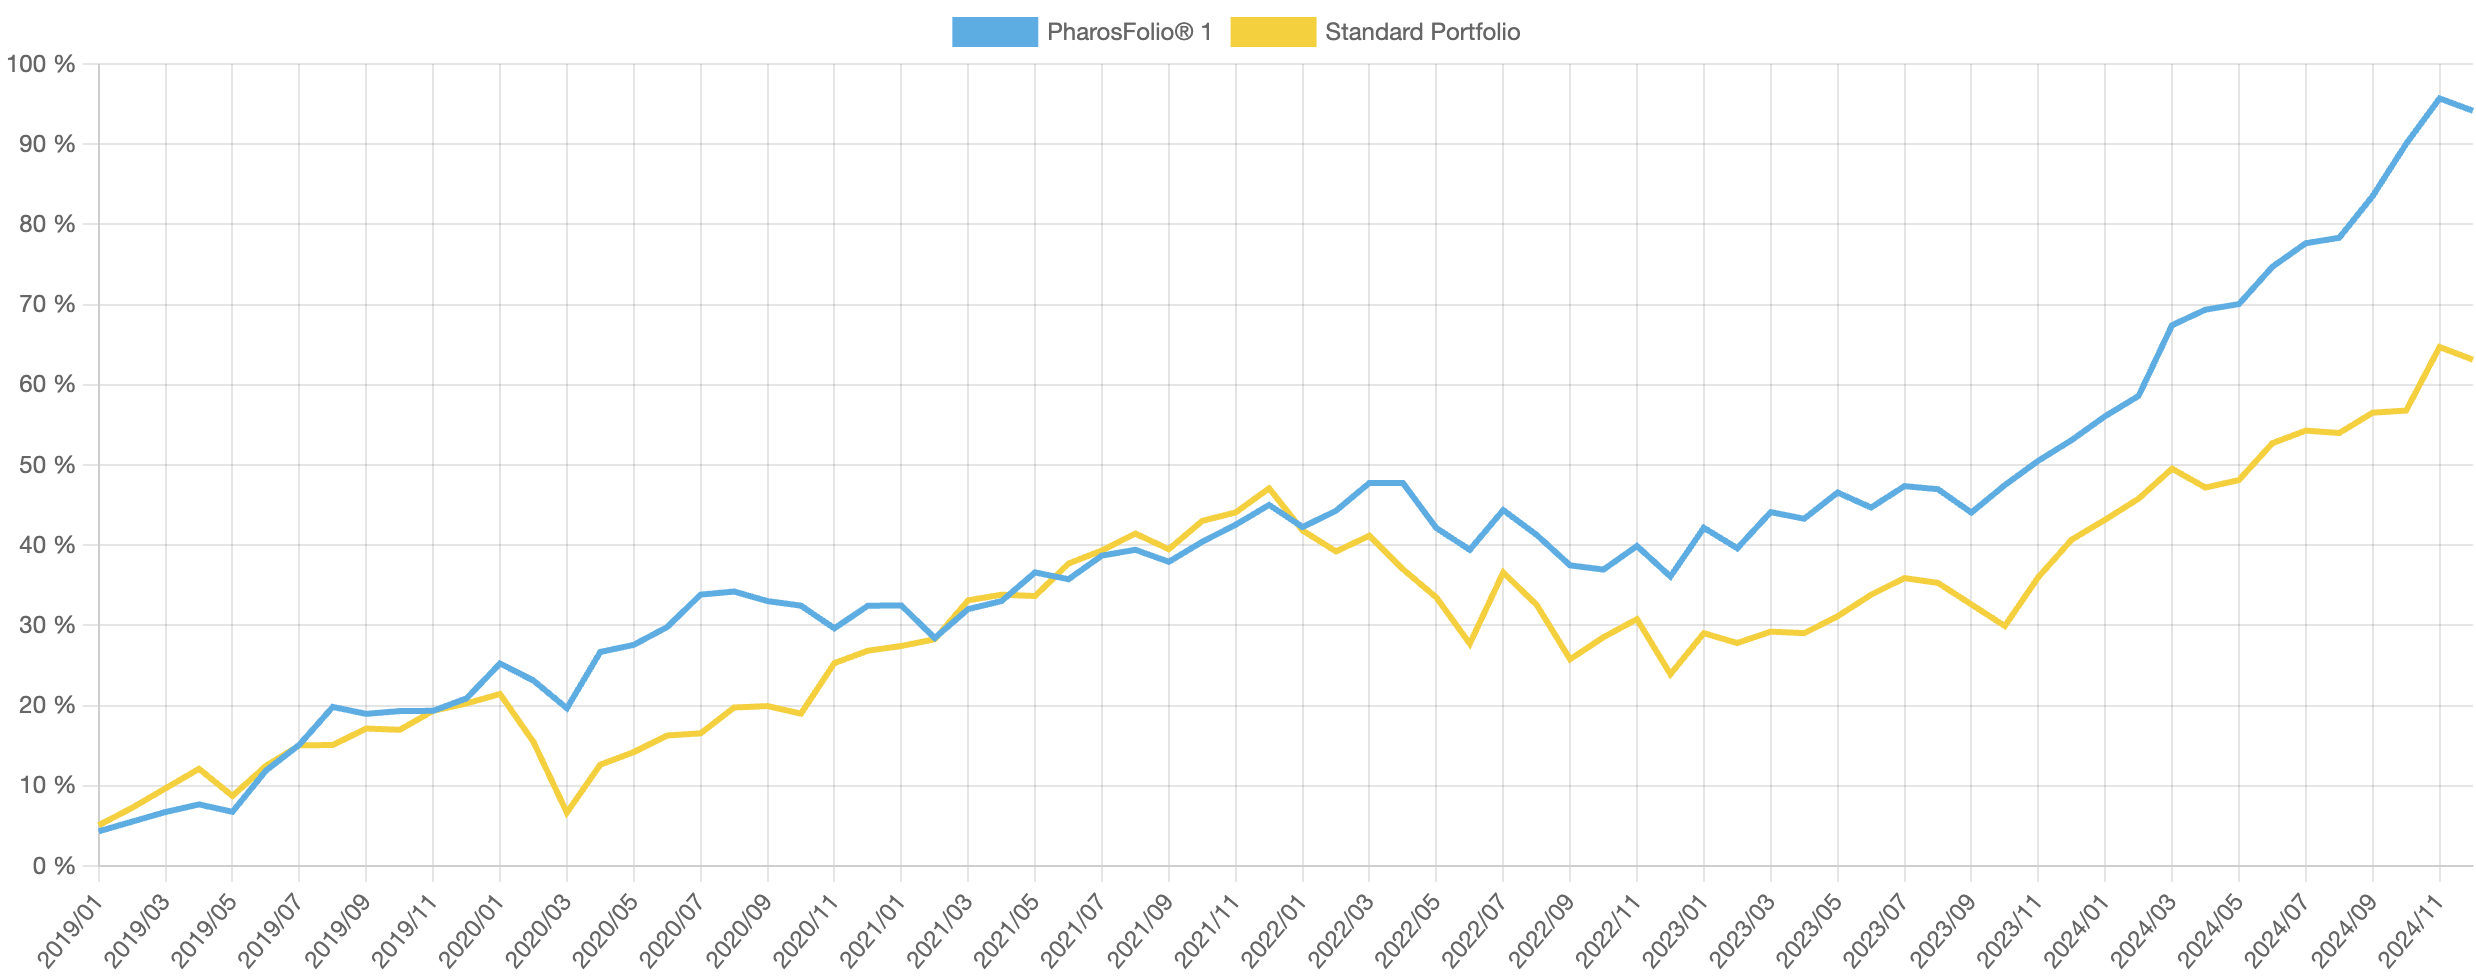
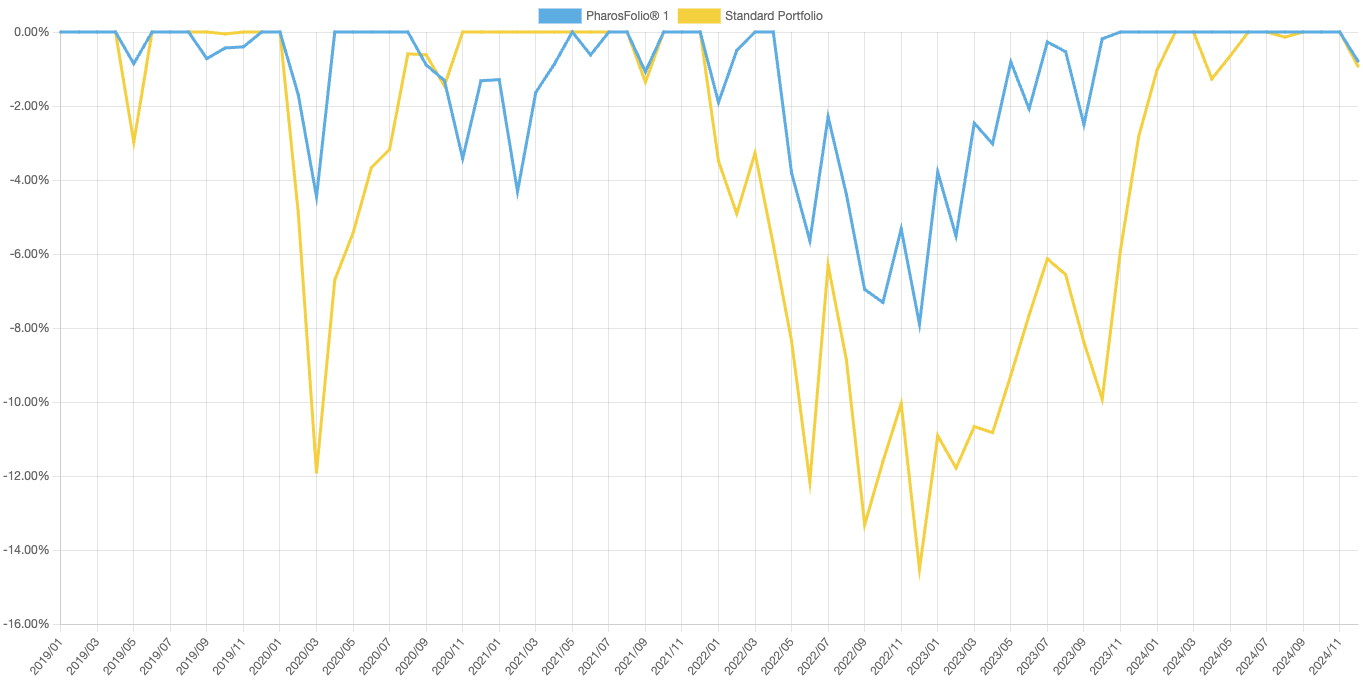
PharosFolio® lets you explore how a single, risk-optimized investment model — built on just three core asset classes: stocks, bonds, and gold — might have performed over time. You choose your preferred risk level, and the simulator does the rest. Simple, guided, and powerful.

Portfolio simulation

What you can do with PharosFolio®

  • • Explore a simple three-asset portfolio

    Simulate a portfolio built on global stocks, Eurozone bonds, and gold through broad ETFs and ETCs, powered by an advanced quantitative model.

  • • See how risk and returns change over time

    Test different risk levels and view drawdowns, rolling returns, and see how a simulated portfolio behaves in different scenarios.

  • • Use adaptive rebalancing

    See model-based examples of how a simulated portfolio could be rebalanced over time using PharosFolio® risk-aware rebalancing algorithm.

Try now

Who is PharosFolio® for?

PharosFolio is designed for investors who want to better understand how an investment portfolio behaves over time and to make their own decisions more consciously, with the help of an advanced quantitative model.

It is especially useful for individual investors who:

  • are interested in diversified ETF/ETC portfolios rather than individual stock picking;
  • prefer to learn from concrete numbers and historical data instead of opinions.

The interface is kept as clear as possible, while the quantitative engine runs in the background.

Learn more
Smiling woman investing

See the Difference in Real Market Downturns

Historical simulations across three major crises show how adaptive rebalancing (PharosFolio® risk level M) responded to market conditions differently than a classic fixed 60/40 portfolio allocation.

What happened: Final phase of the dot-com bust (2000‑2002) combined with accounting scandals such as Enron and WorldCom eroded confidence in tech and corporate governance, dragging global equities lower while safe havens held up.

Performance During Dot-com Aftermath (2002-2005)
Performance comparison: PharosFolio® (risk level M) vs 60/40 during dot-com aftermath 2002-2005
Maximum Drawdown (Temporary Loss)
Drawdown comparison: PharosFolio® (risk level M) vs 60/40 during dot-com aftermath 2002-2005
Max Drawdown Recovery Time Performance/Risk
PharosFolio® -11.02% 23 months 0.43
Standard 60/40 -19.32% 33 months 0.12

What happened: The global financial crisis triggered by U.S. subprime mortgages (2007‑2009) and the subsequent eurozone sovereign-debt stress (2010) caused deep drawdowns and a sluggish recovery for traditional allocations.

Performance During 2008 Crisis (2007-2010)
Performance comparison: PharosFolio® (risk level M) vs 60/40 during the 2008 financial crisis
Maximum Drawdown (Temporary Loss)
Drawdown comparison: PharosFolio® (risk level M) vs 60/40 during the 2008 financial crisis
Max Drawdown Recovery Time Performance/Risk
PharosFolio® -11.09% 17 months 0.82
Standard 60/40 -27.65% 29 months 0.19

What happened: The COVID‑19 pandemic (2020) and the rapid interest-rate tightening cycle that followed (2022‑2023) produced two sharp shocks—first a historic crash, then volatility driven by inflation and rate hikes.

Performance During COVID + Rate Shock (2019-2024)
Performance comparison: PharosFolio® (risk level M) vs 60/40 during COVID + rate shock period
Maximum Drawdown (Temporary Loss)
Drawdown comparison: PharosFolio® (risk level M) vs 60/40 during COVID + rate shock period
Max Drawdown Recovery Time Performance/Risk
PharosFolio® -7.90% 19 months 1.36
Standard 60/40 -15.75% 26 months 0.85
Important: These simulations are based on historical data. Past performance does not guarantee future results. For educational purposes only.

1 discover

Explore how different risk levels shape performance. Simulate scenarios and find the balance that matches your goals.

2 plan

Let the simulator's forecast engine help you define your next allocation. Plan regular rebalancing in line with your chosen risk level and market conditions.

3 track

Monitor your simulated portfolio and stay on course. Optional email alerts can remind you to update your rebalancing simulation.


globe--v1

Horizontal Diversification

Combines global equities, EU bonds, and gold to reduce volatility.

vertical-diversification

Vertical Diversification

Uses highly diversified ETFs and ETCs to replicate entire markets.

operational-efficiency

Operational Efficiency

Adaptive rebalancing that historically responded to market risk — not just the calendar.

low-cost-etf

Low-Cost ETFs & ETCs

Significantly lower management fees compared to active funds.

reduced-trading-costs

Reduced Trading Costs

Fewer transactions mean lower trading costs and taxes.

effortless-simplicity

Effortless Simplicity

A clean, intuitive interface that helps you align your portfolio decisions with your goals.